We all know Noah Syndergaard throws exceptionally hard. His fastball has averaged 97.8 mph over the course of his first two seasons in the majors. Here I wish to help visualize what this velocity looks like when compared to the rest of major league fastballs.
First, I need a visual backdrop to help set the scene. In the Pitch Stats section of the site I have an embed Tableau sheet depicting the major league average swinging strike rates with respect to spin rate, x coordinate, z coordinate, and pitch velocity. Here, I'll be using the velocity table. It looks something like this.
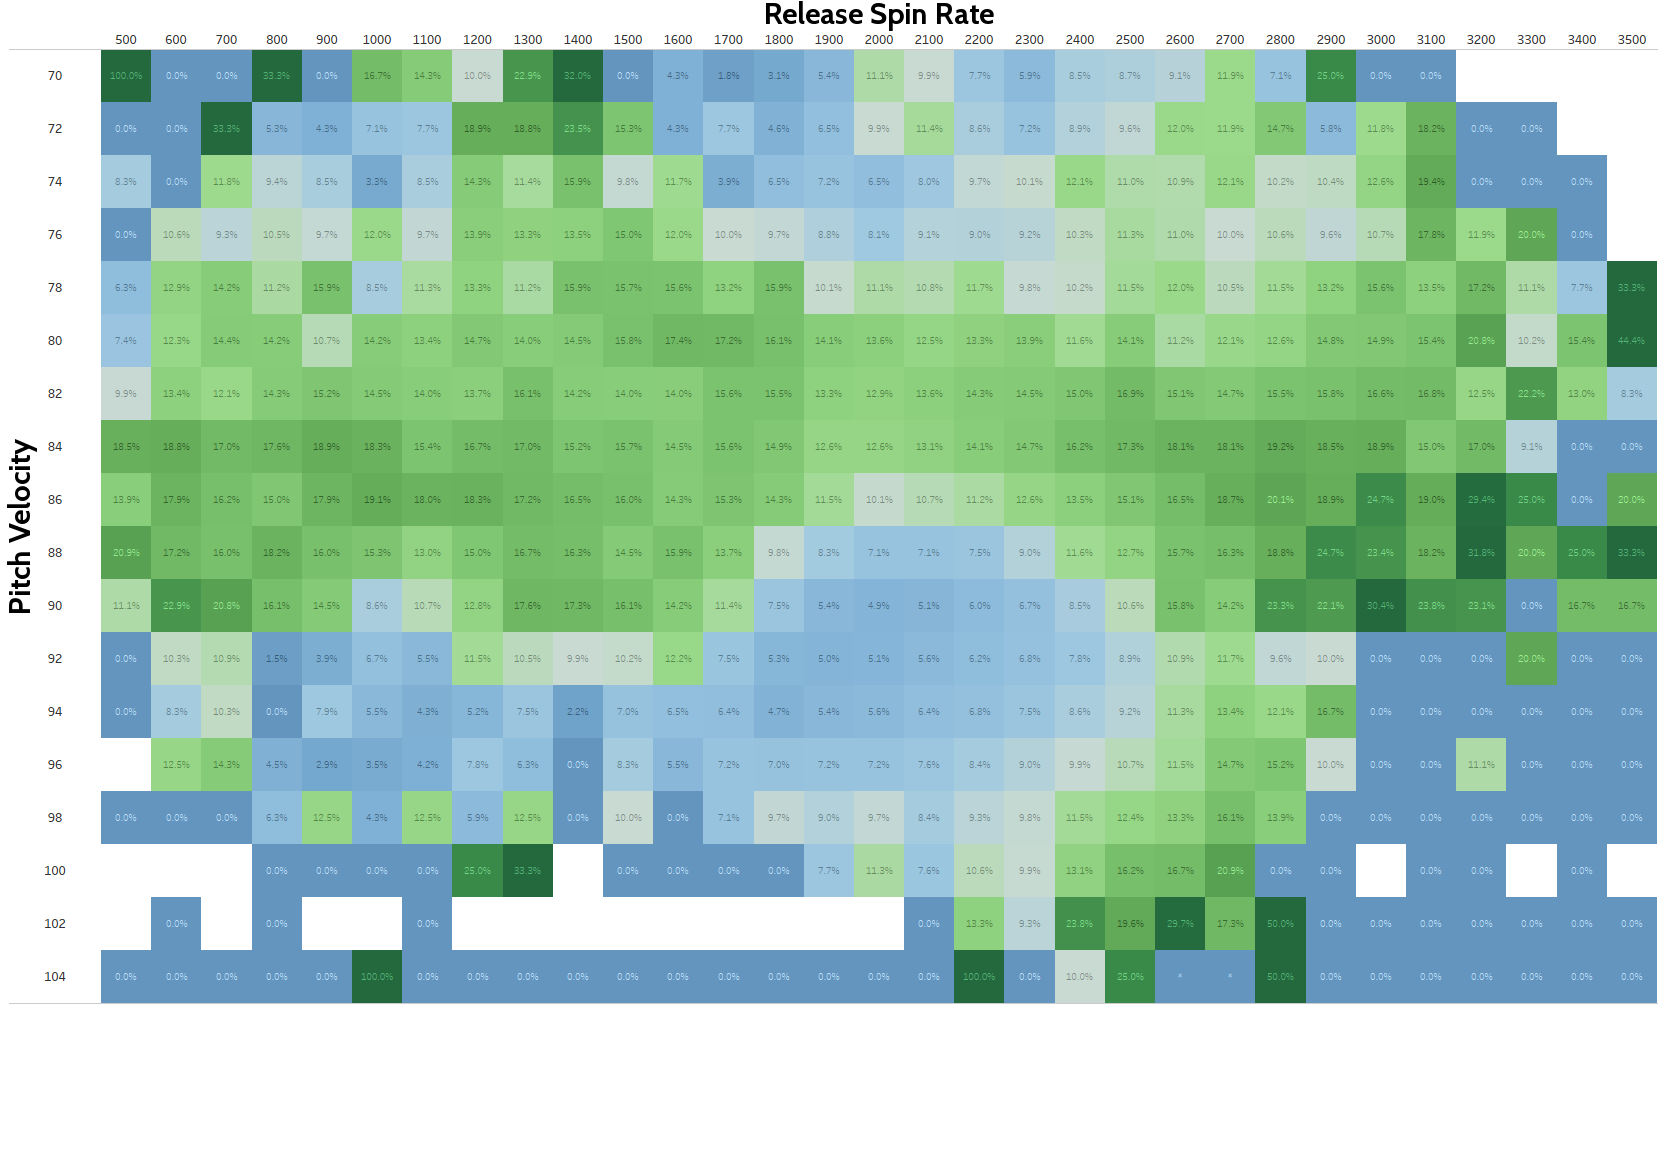
This chart looks a lot like a map, with the blue area's looking like sea and the green like land. That wide blue area in the middle is the Sea of Fastballs, as you may notice going forward.
On this chart, darker shades of green represent higher swinging strike rates, while deeper shades of blue represent lower swinging strike rates. Gray regions are roughly average, and the blank white areas are unmapped (contain no data). If you go to the embeded Tableau Viz, you can click on each box to see more information, such as the number of fastballs/breaking balls/off speed pitches land within the box zone, the number of swinging strikes, etc. I encourage you to play around with that tool, it is fun to look at.
The average major league fastball is 91.8 mph, with a spin rate around 2220. The standard deviations are 2.9 and 200 respectively. I have mapped this average fastball onto this chart and color coded it roughly in conjunction with the standard deviations. It isn't exact, but they are pretty close. (Frankly, I was running out of time and this plot was taking longer to make than expected).
The algorithm that rendered this gif, which was designed to have a smooth transition between 100% and 0% opacity, introduced this weird pixelation effect. It is unintentional, but it looks kinda cool.
Okay, so that white section there highlights the average fastball, it sits between 90 and 94 mph (91.8mph average) and 2000 and 2400 rpm (2220 average). The white section contains 50% of the fastballs thrown between 2015 and 2016. As you move out, redder areas represent above average fastballs, and bluer areas represent below average fastballs. Combined, the shaded areas contain 99.7% of the fastballs thrown between these two seasons.
Okay, now that we have some frame of reference, let's take a peak at Noah Syndergaard.
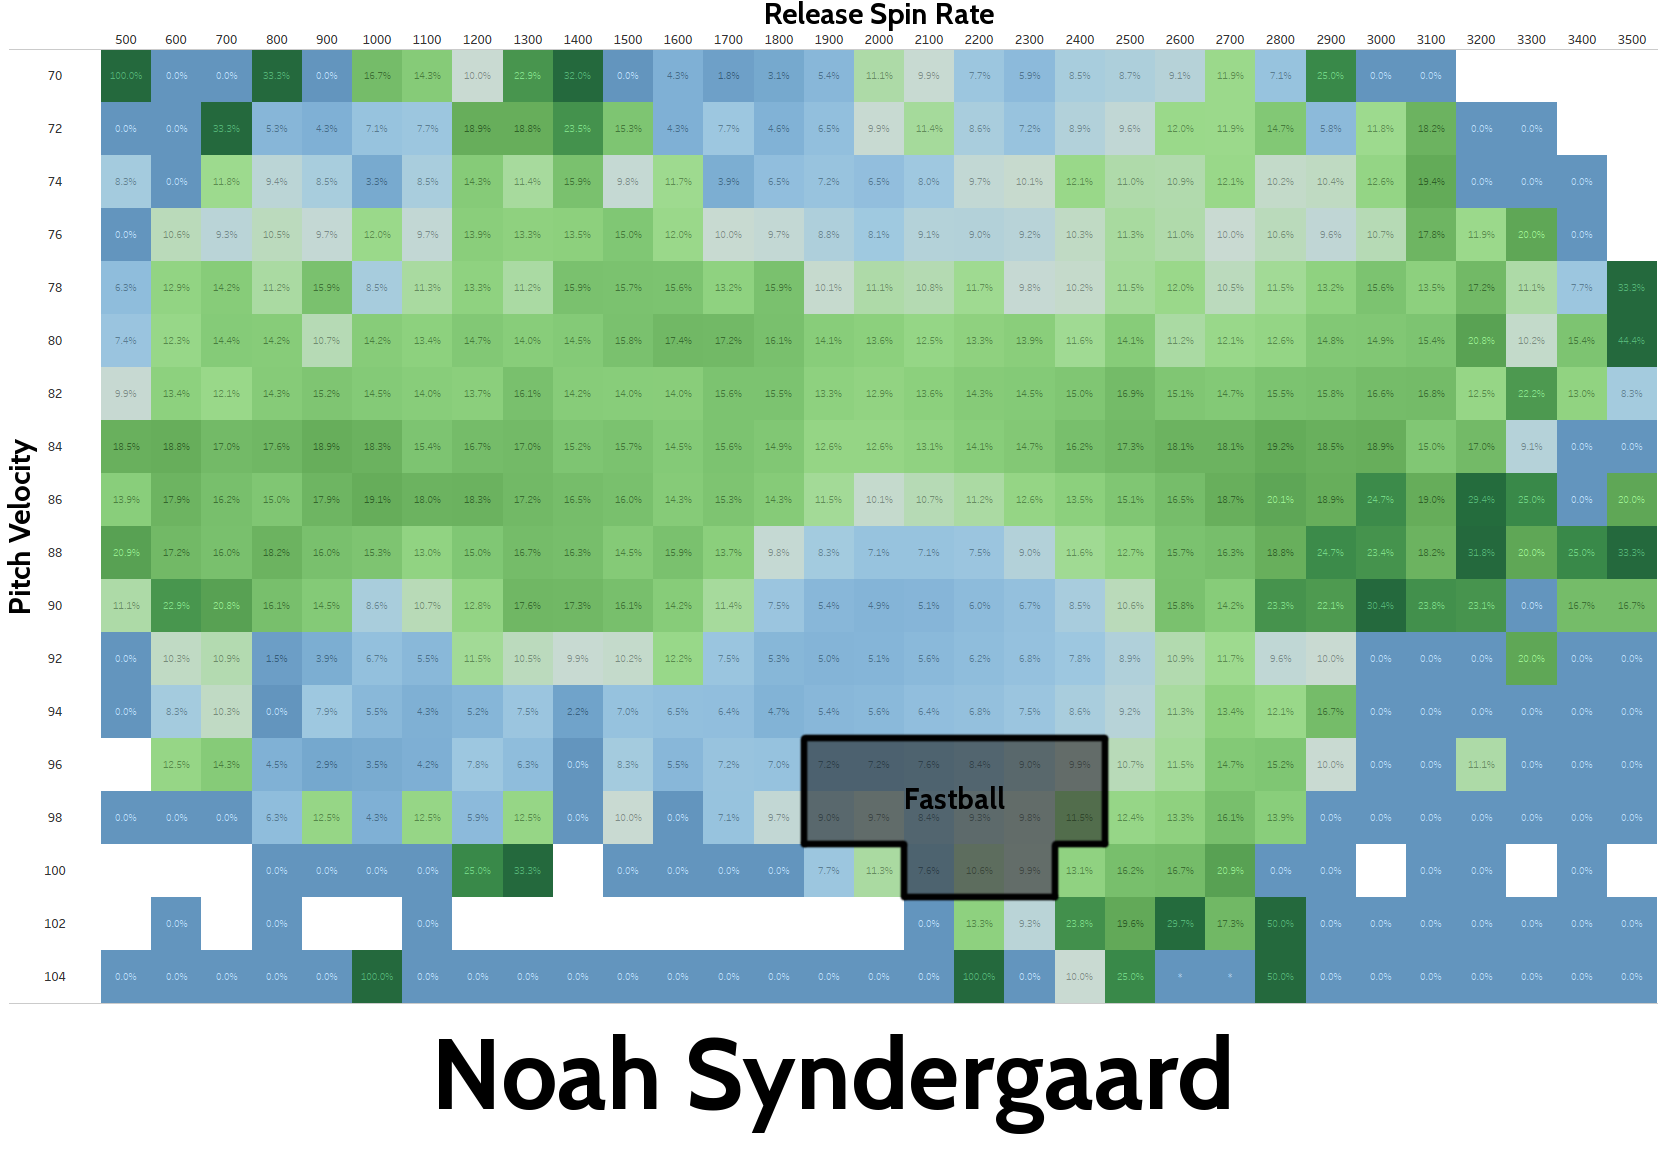
Syndergaard's fastballs live in the southern part of the Sea of Fastballs, nestled up to the Cape of Good Cheese. This section of the sea ranges from 7.2% to 11.5% swinging strike rate, which, and this isn't any sort of measurement but moreso a feeling I get looking at the numbers, the average is probably somewhere around 9%, judging by this chart. Using a more scientific method (using the gameday stats), the actual rate turns out to be 9.5%. So the chart got us in the right ballpark.
PS, you may get different numbers from Brooks Baseball, this chart was made using Gameday.
Okay so here's the money shot, I've overlayed Syndergaard and the average fastballs.
I included Syndergaard's slider, too, just to rub it in.
Noah Syndergaard's fastball is towards the extreme high end of fastball velocity, obviously. It sits around 97.8 mph, which is ridiculous. The spin rate, though, is more mundane, and actually below average. The average spin rate is 2220 rpm, and Syndergaard's is instead 2174. Not terrible, but not otherworldly by any stretch of the imagination. It is somewhat odd, though, as fastball velocity generally correlates with spin rate, with the highest velocity fastballs generally having the highest spin rates. Generally, not always. But preferably.
Before I said Syndergaard's fastball is nestled up against the Cape of Good Cheese. I mean that, you want to live on that Cape, it is the home of the best fastballs in the game. Syndergaard is tantalizingly close, but not quite there. He can jump on the southern tip by picking up a few miles per hour on his fastball, which is something he apparently feels inclined to do. More realistically, and also much more valuably, he could add spin rate. Adding 200rpm could increase his expected swinging strike rate by 50%, perhaps even 100%. That would put him in the same camp as Aroldis Chapman (100.6mph, 2508 rpm, 19.2% SwStrk%), Dellin Betances (98mph, 2448 rpm, 12.5% SwStrk%), and Craig Kimbrel (97.7mph, 2458 rpm, 12.5% SwStrk%).
Finally, in case you're curious, here are all of Syndergaard's pitches mapped on this chart.
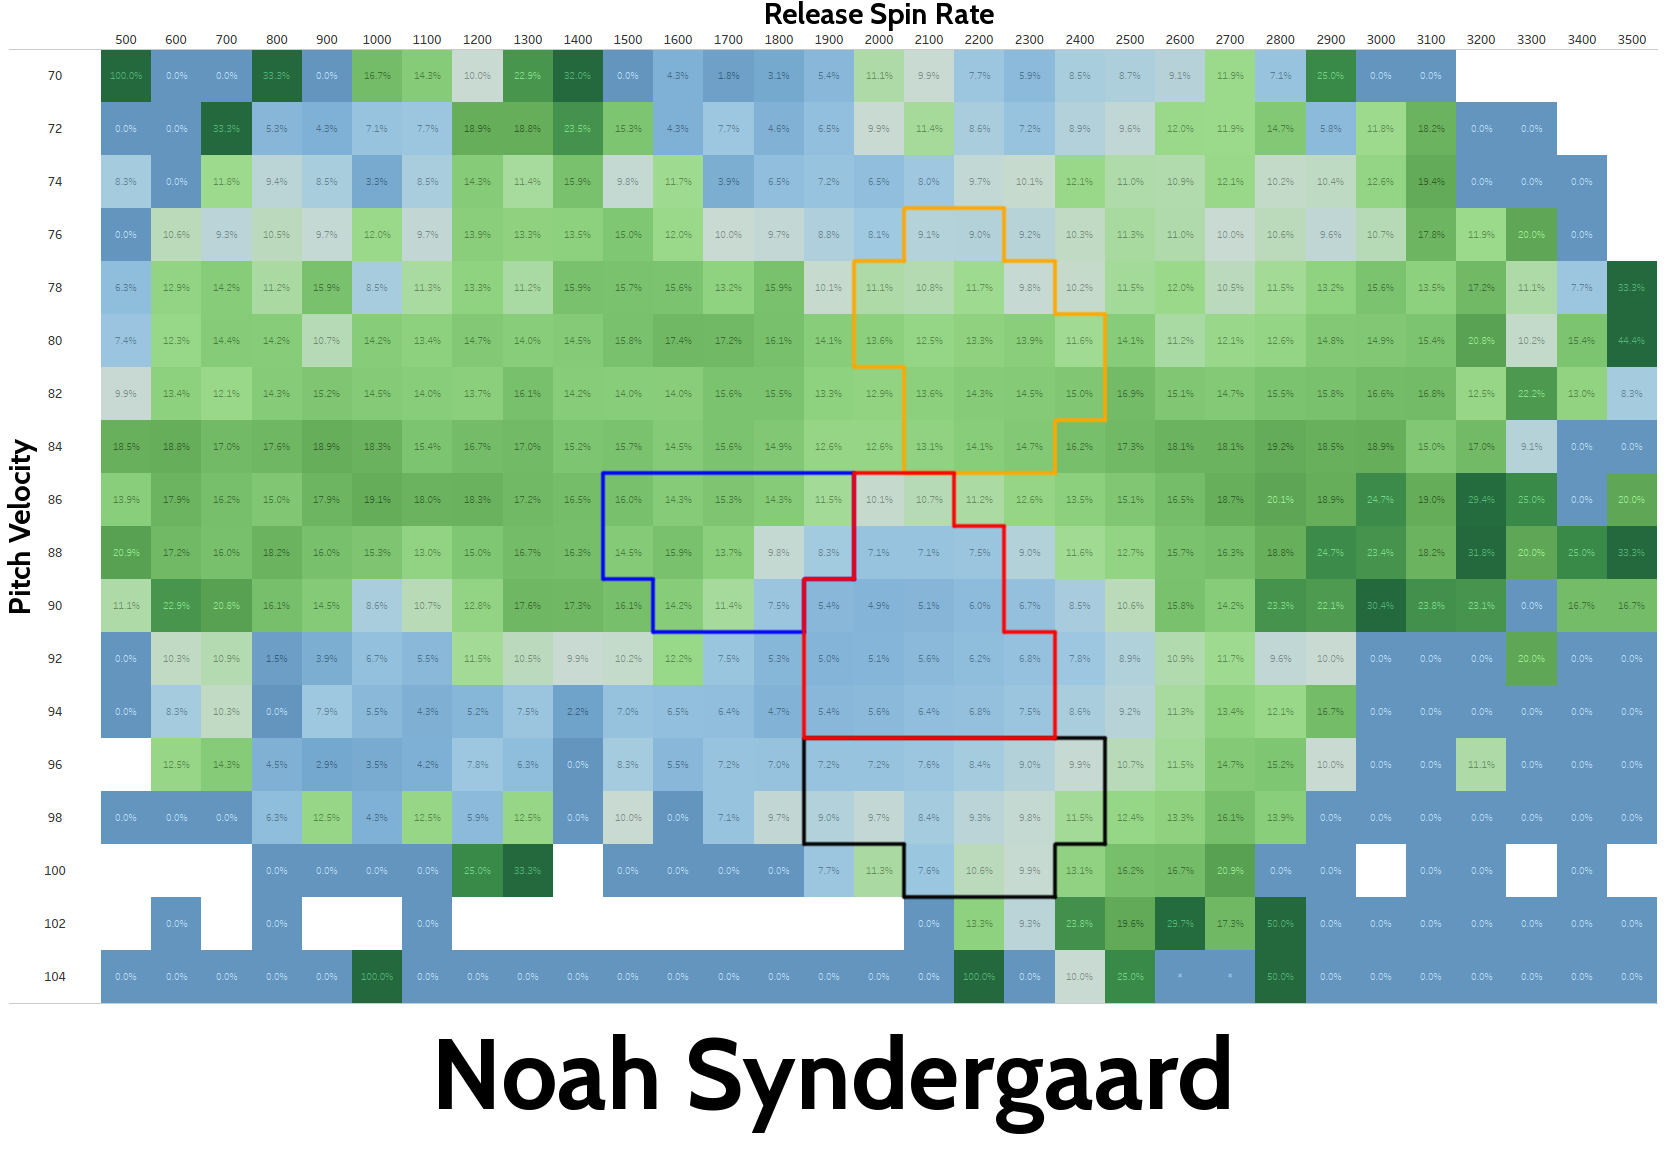
Orange = Curveball, Red = Slider, Blue = Changeup, Black = Fastball